Crypto Share of Search
A new indicator to help you optimize crypto portfolio growth.
In established markets the share of search indicator has proven itself to be of predictive value for the share of market of a brand or company. Using similar methods, this indicator has been applied to the crypto market with significant results.
In this post explains the workings and predictive value of crypto share of search indicator.
Disclaimer: This post cannot be interpreted as financial advise. This post is for educational purposes only.
Summary
- What is the share of search?
- Application in the crypto market
- Results
- Relevant applications
1. What is the share of search?
The share of search metric compares the interest people have in a brand or company towards the interest they have in competitors using search engine data. This share of search indicator was researched and presented at Effworks by Les Binet, marketing academic and Group Head of Effectiveness, adam&eveDDB (source).
The crypto share of search is the application of the share of search indicator in the crypto market. In this application we model the relative share of search of a crypto project towards the relative share of market cap of the corresponding project.
In sections below explain the origin of the share of search indicator and its significance for market share predictions.
1.1 Background
Les Binet was interested in a modern market indicator that explains share of market (SOM) growth besides the share of voice (SOV). The share of voice metric compares the share of marketing spend of competitors in a market and has been established as a valueable indicator for market share growth in multiple academic papers (Perry, C. L. (1998), Hansen, F., & Christensen, L. B. (2005)) Marketing academic Mark Ritson has a video explaining this predictive relation between SOV and SOM.
However in the digital age, determining the marketing spend of competitors has become increasingly difficult and therefore the share of voice indicator has become more unreliable for market researchers. It is for this reason the Share of Search (SOS) was developed and introduced by Les Binet.
1.2. Share of Search significant findings
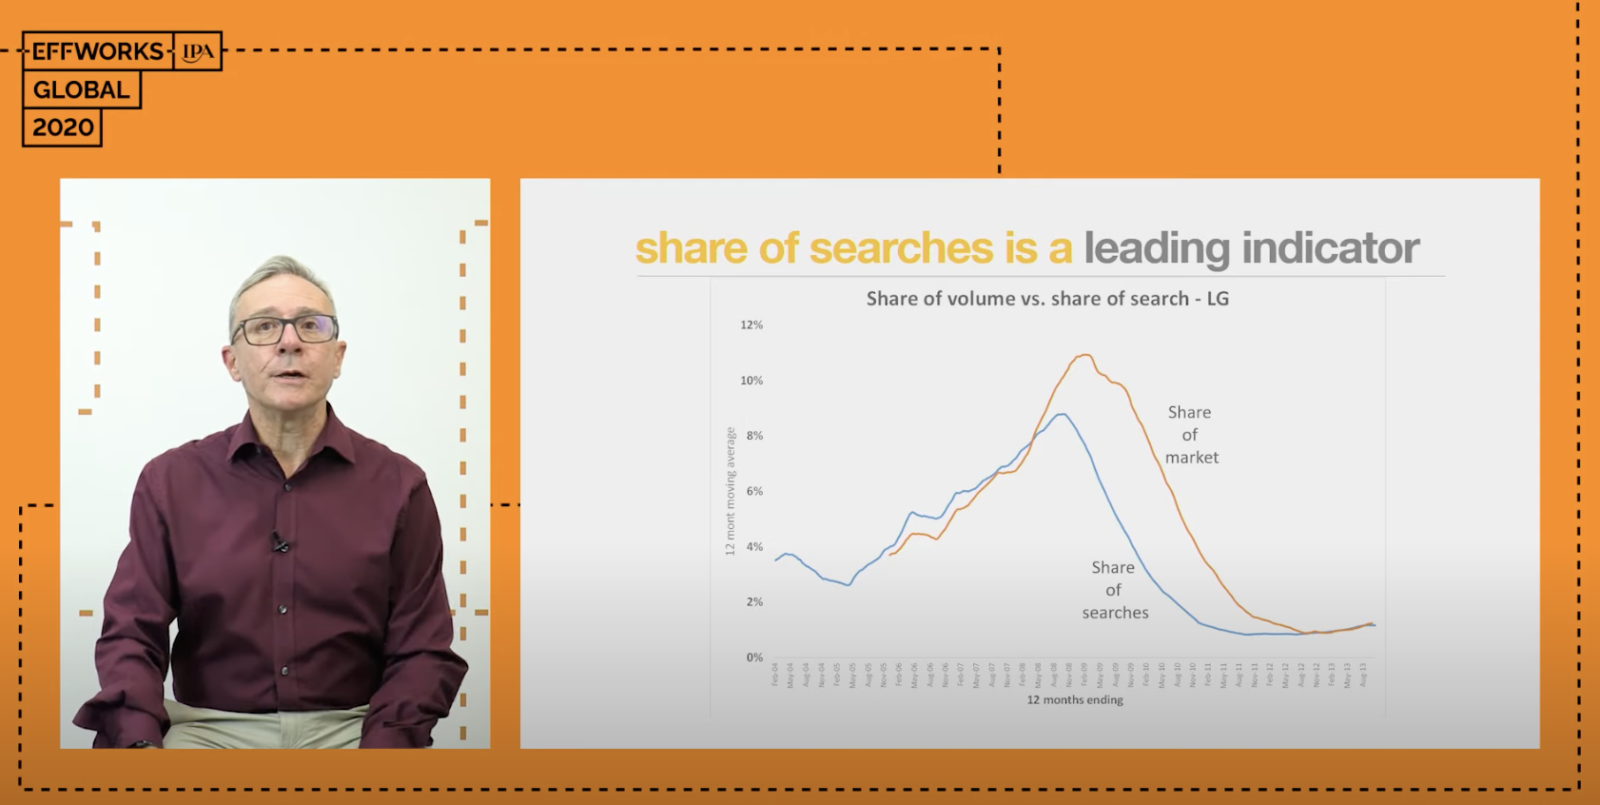
Les Binet uses Google Trends data to calculate the relative share of search of a brand in a market and modelled it towards the share of market of the corresponding brand. He researched brands in 3 markets: energy, automotive and mobile phone handsets. Here are some of his significant findings relevant for this post:
- Share of Search correlates with market share in all three markets.
- Share of Search (SOS) is a leading indicator / predictor of Share of Market (SOM) – when Share of Search goes up, Share of Market tends to go up and when Share of Search goes down, Share of Market falls. The gap between them – the Extra Share of Search (ESOS) – is a particularly solid indicator of market share movements.
- The lead time for Share of Search on Share of Market can be substantial, up to a year for the car market.
- Share of Search is not a perfect predictor though, as conversion is, of course, affected by other factors, particularly price. Equally, not all search activity is positive.
- Share of Search could be a new measure for brand strength/health of their brand by measuring the base level of Share of Search without advertising.
These findings and more are stated in this article or watch his full presentation at Effworks on Youtube.
2. Application of SOS in the crypto market
The Share of Seach metric has proven its value in traditional markets, therefore it is time to research its value in the crypto market.
There crypto market lends itself perfectly for our application:
- The crypto market is very emotion-driven. Fear, greed, panic and FOMO explain much of the crypto market’s behavior. This emotinoally behavior is often closely linked to search behavior
- The crypto market is very fast-paced. This likely means shorter lead times between SOS and SOM and therefore many timeranges to research the possible relation between the two metrics.
- The crypto market share and pricing data is publicly available. Compared to traditional markets, the crypto market is completely transparent when it comes to monitoring market share if we use market cap as its indicator.
Limitations
There are, however, also some limitations, mainly due to Google Trends:
- The Share of Search requires comparative data. Google Trends cannot compare crypto projects with too large discrepancies in search interest. Calculating the SOS of Bitcoin compared to top 2000 market cap coins would not make sense. We need to compare projects within range of each other. E.g. top 20 crypto coins can be compared based on search interest.
- Google Trends retrieves search interest for provided search keywords. Therefore, if a crypto currency does not have a unique or semantic name, Google Trends could include other search interest data in the mix. This makes getting the real SOS of crypto projects like “Tron” and “THETA” very difficult.
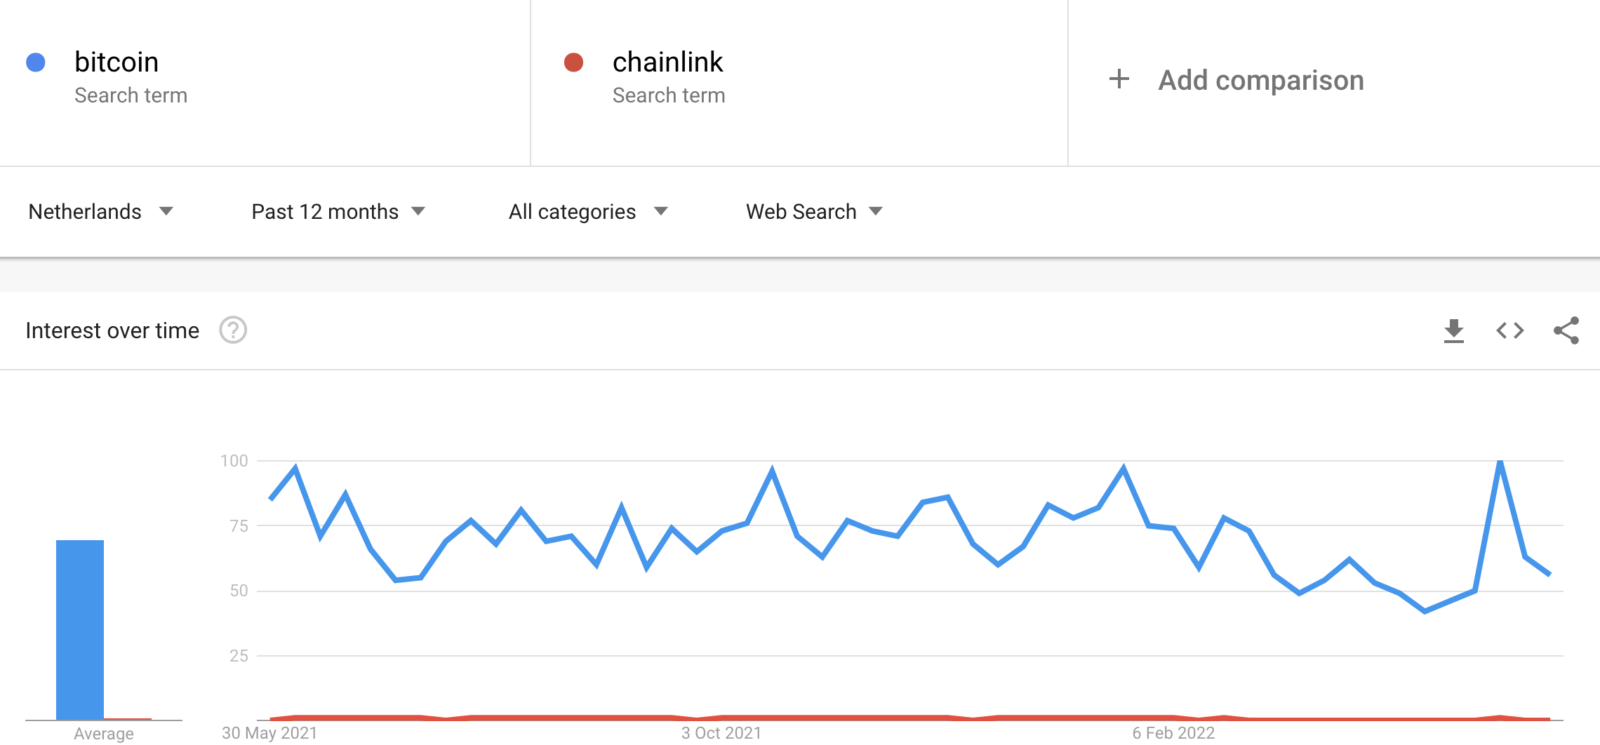
- Google Trends is able to classify certain searchterms in categories. For instance; Bitcoin can be monitored as a “search term” or as “cryptocurrency”. Some classified trends can be very similar, but some are definately not. However not every crypto project is classified and not all crypto projects are classified in the similar categories, making fair comparisons difficult. This complicates usage of categories whenever a crypto project doesn’t got a unique semantic name.
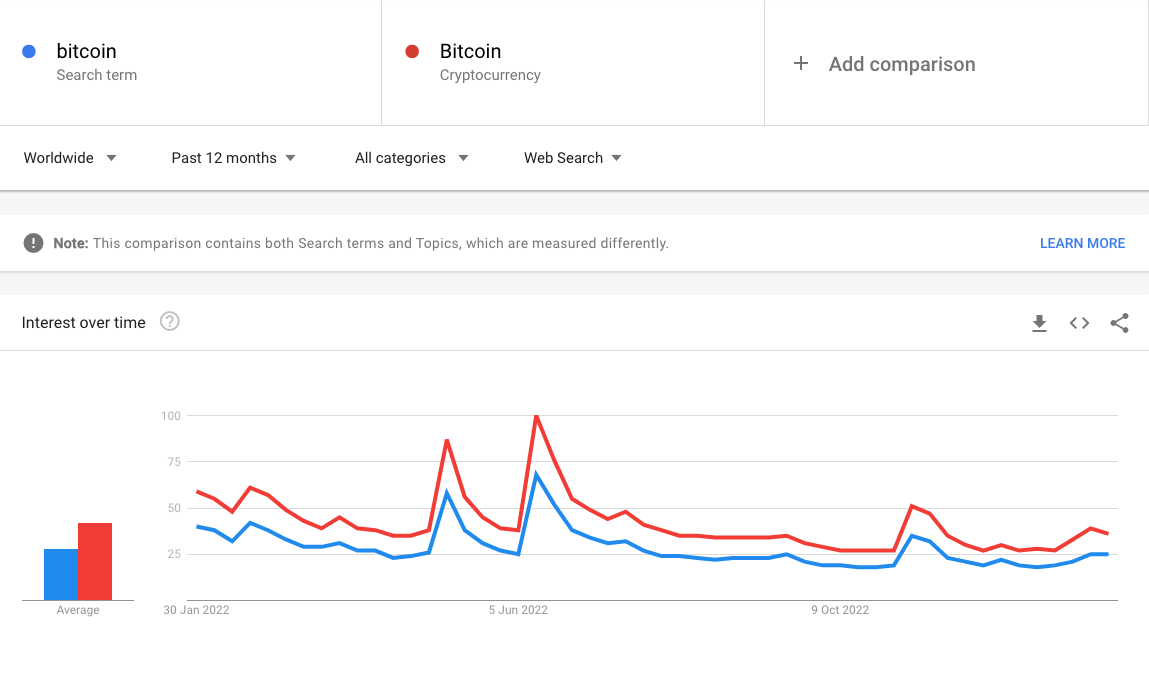
While bitcoin does show similarities in the Google Trends data. This is certainly not the case for the “Stellar” project. This project is classified as “payment network” at the moment and the trend and volumes differ quite a lot from the “search term” trend. This will make integrating Stellar more complicated.
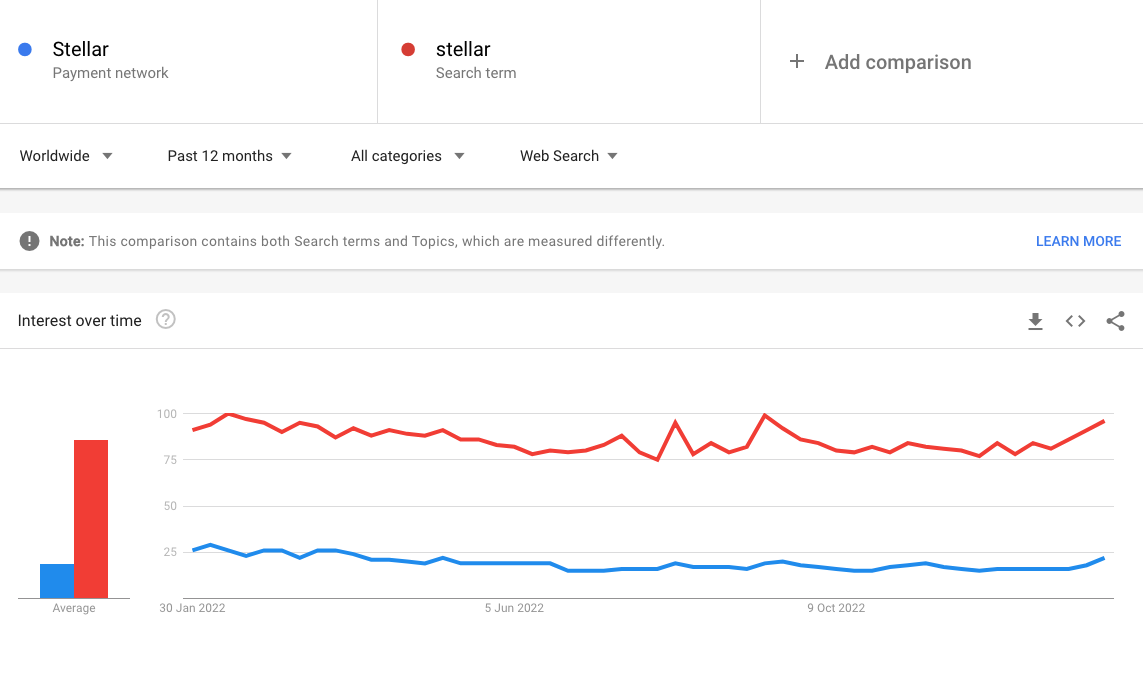
Luckily, these limitations can be overcome and the Share of Search trend can actually be trended very well for most of the popular crypto projects.
To see which crypto projects are tracked right now and the assumed data quality, see the tracking status dashboard.
3. Data setup
This section explains the data sources and analytical processes to get to the indicators of interest.
3.1. Data sources
To calculate the Share of Search and the Share of Market within crypto, we actually require two data sources; Google Trends and a crypto market tracker like CoinGecko. Both datasources can be accessed without costs (for now), but it does require some programming skills.
3.2. Data preparations
Data is being exported from data sources on a scheduled interval (based on data requirements desired data “freshness”) directly towards a data warehouse. We’ve set up a process to make data extraction from the datasources reliable. After extraction, data is refined, evaluated and stored in an efficient matter for usage in analytics and data visualizations.
3.3. Creating KPIs and trends
After the data is extracted and refined, the data is transformed into the KPIs of interest;
- The Crypto Share of Search based on Google Trends data
- The Crypto Share of Market based on the Coingecko data
Both KPIs are calculated on a scheduled interval (similar to the data extraction intevals). After both KPIs are created we join these KPIs using the date and/or time as the dimension to join the data on. This wil result in a dataset in which we can monitor both the Crypto Share of Search and Crypto Share of Market over time.
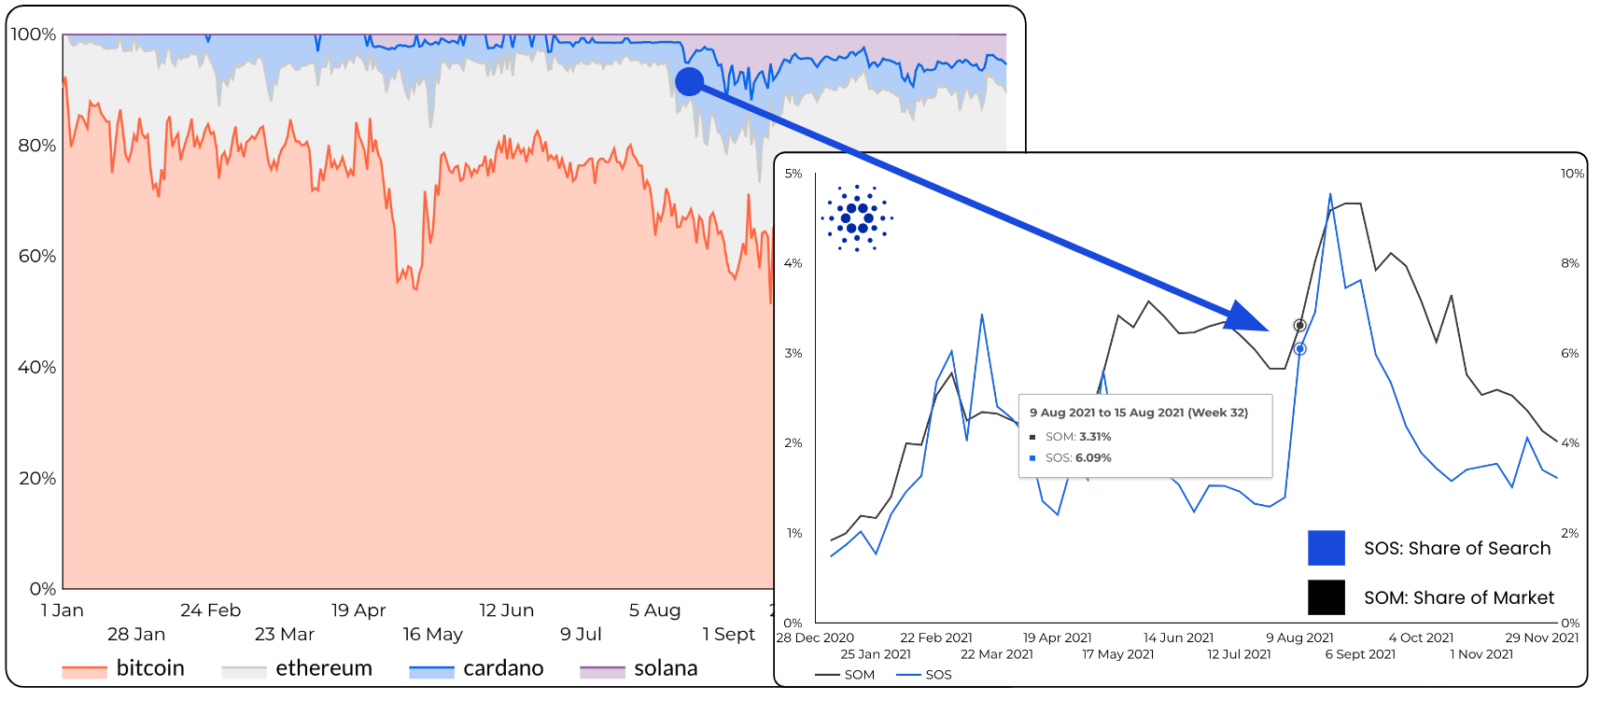
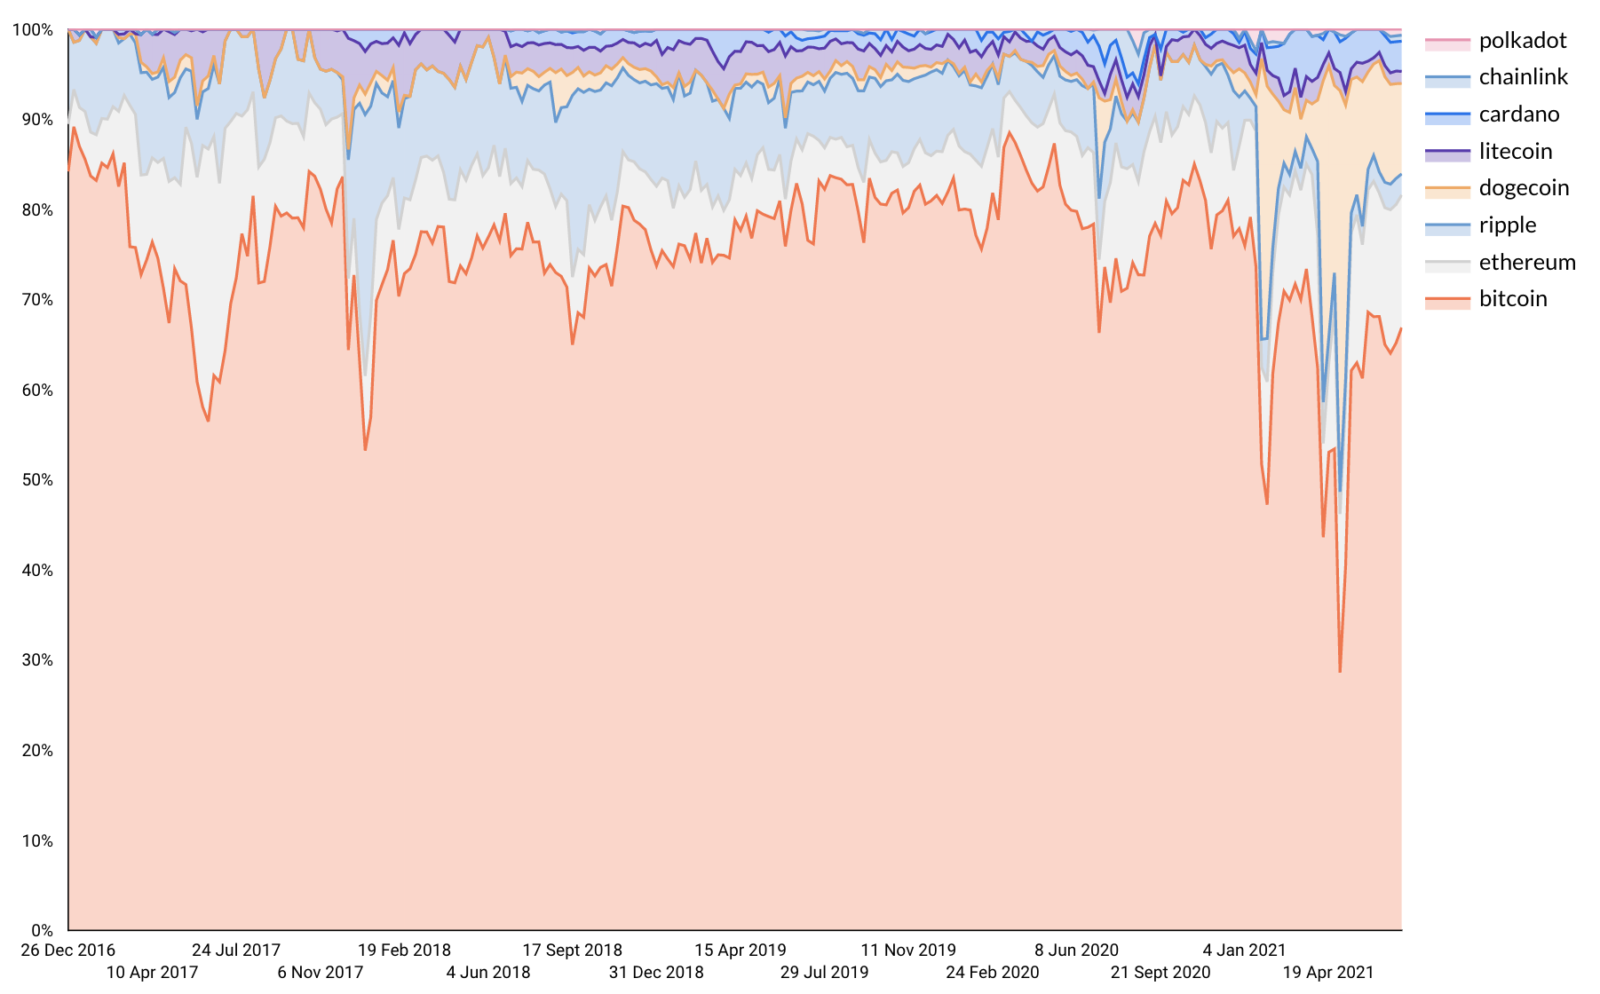
The Crypto Share of Search KPI allows us to create a visual as shown in the top of this post, an area chart of the relative share of each included project in the analysis.
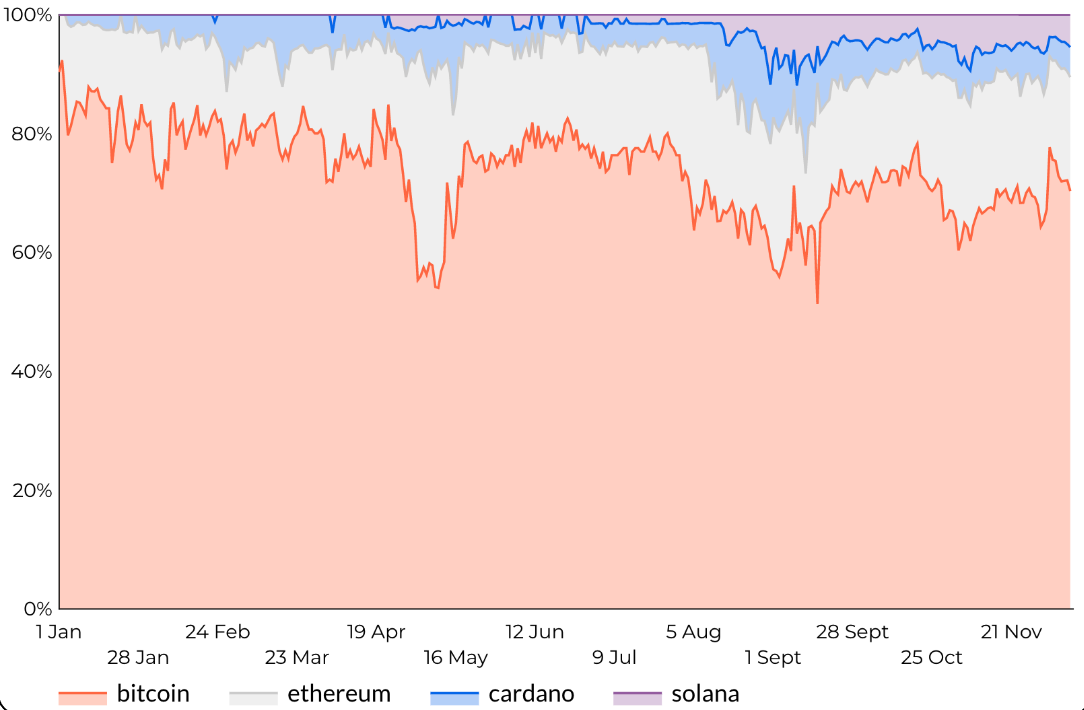
Each area in the image above shows the “search dominance”, similar to the market dominance of crypto project.
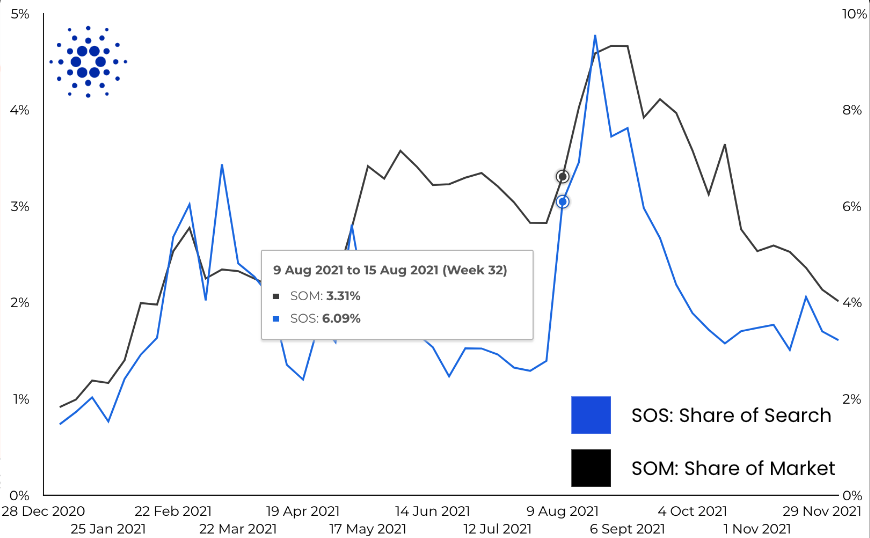
After creating the Share of Market KPI as well, both of them can be trended and analyzed in the same graph.
The example below shows the the Share of Search and Share of Market trend of Cardano in a the period similar to the Share of Search Graph above. The correlation is strong!